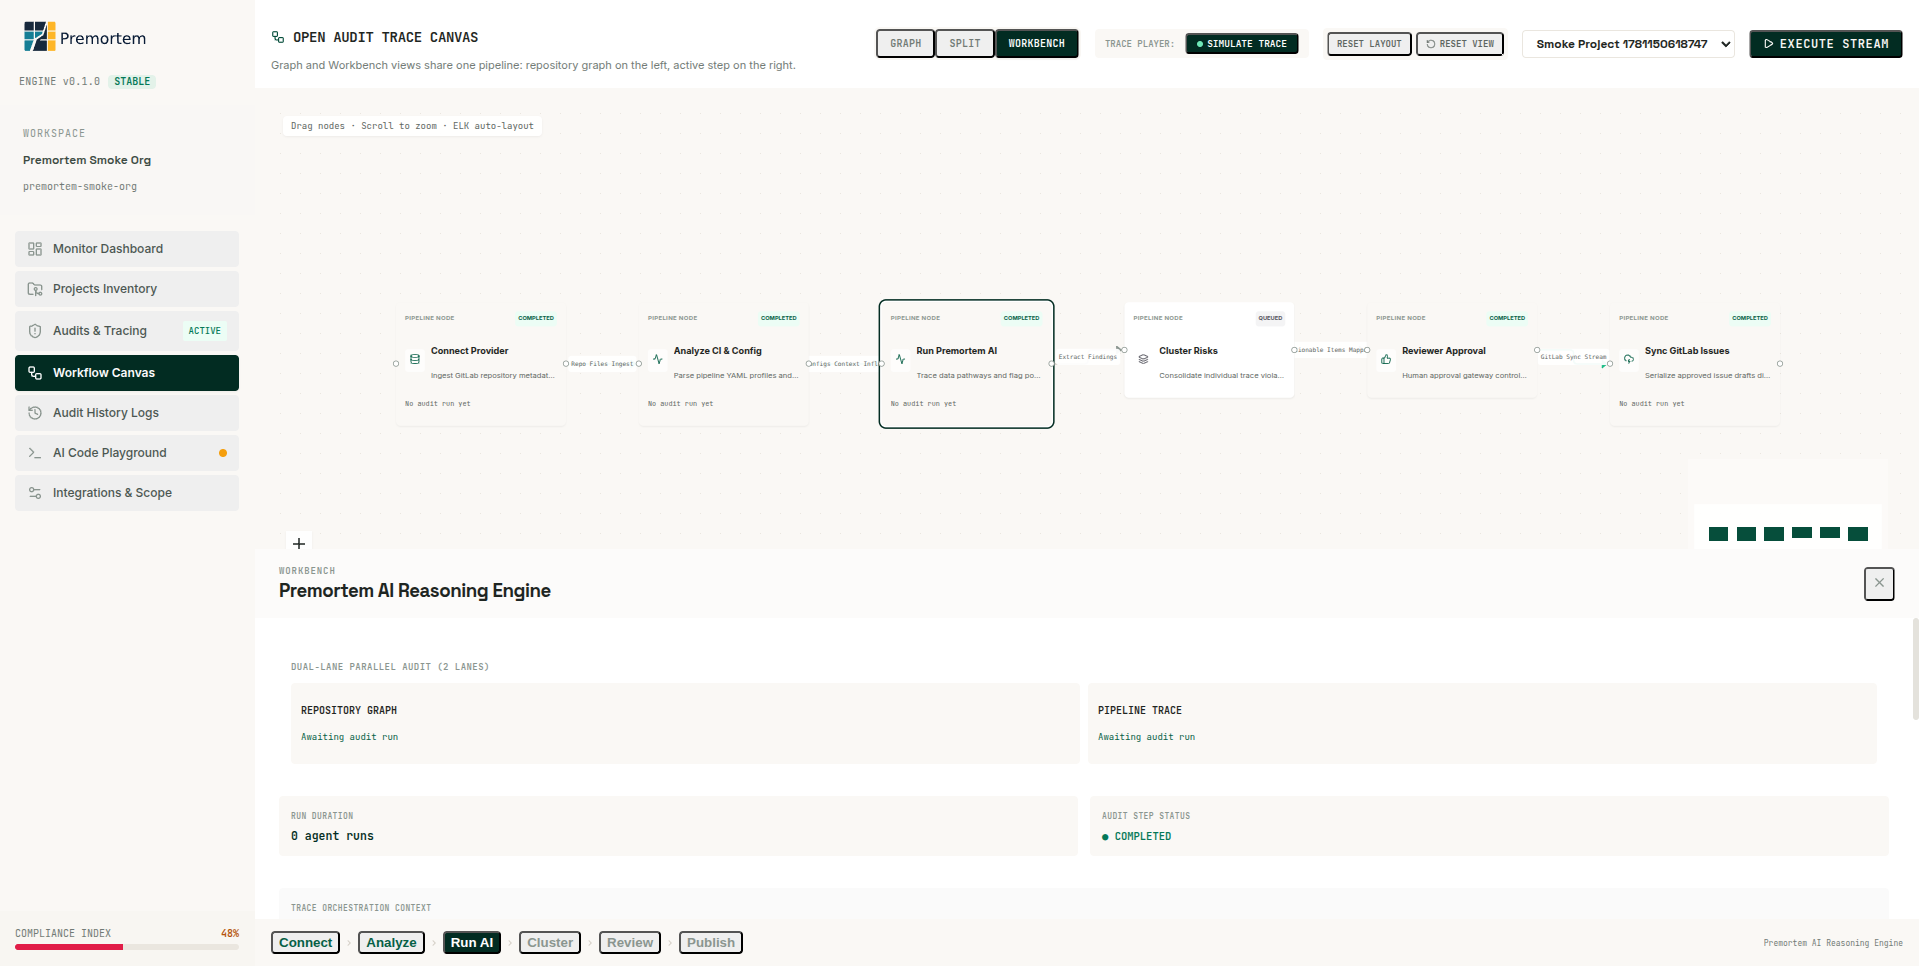
Trace the audit pipeline from connect through publish with graph and workbench views.
Who this is forOperators who want a visual map of pipeline progress and dual-lane swarm execution.
Prerequisites- At least one connected project.
- One audit run started or completed.
Workflow Canvas: pipeline nodes plus workbench for the active step.View modes
- Graph: repository topology and pipeline nodes in one canvas.
- Split: graph on the left, active step workbench on the right.
- Workbench: focus on the selected pipeline step telemetry.
Pipeline steps
- Connect Provider → Analyze CI & Config → Run Premortem AI → Cluster Risks → Reviewer Approval → Sync GitLab Issues.
- Step badges show queued, running, completed, or failed states.
- Select a step to load its workbench context.
Workbench
- Dual-lane parallel audit: Repository Graph lane and Pipeline Trace lane.
- Agent runs and findings appear as the orchestrator advances.
- Run duration and audit step status update in real time during active runs.
Controls
- Execute Stream: trigger or resume pipeline execution for the selected project.
- Preview layout: view canvas placement without starting a live run.
- Reset Layout / Reset View: restore canvas zoom and ELK auto-layout.
Expected result
You can read pipeline step status, switch graph/split/workbench modes, and inspect dual-lane agent output.
Was this article helpful?